Course description

Know the basics of Python and want to use it on real data? This course shows you how to load, clean, combine, summarise and chart business data with pandas and matplotlib, and then turn your work into a report that runs itself.

It's a full course, not a few quick tips. There are 10 sections and 50 written lessons, each with code written out in full, the real output it produces and a practical exercise. Every section has a practice pack with the data files, starter scripts to complete, full solution scripts and a cheat sheet. All of it is built on a year of realistic orders, website visits, market stall takings and survey answers for a fictional loose-leaf tea company in Harrogate. You follow its operations assistant as he moves the business's reporting from copy and paste to Python.


What you'll learn

  • Setting up: Python, pandas, matplotlib and openpyxl in a virtual environment, and scripts that always find their data.
  • Selecting and filtering: loc, iloc, conditions, isin, query, sorting and new columns.
  • Cleaning messy data: missing values, wrong types, £ signs, duplicates and untidy text.
  • Dates and times: parsing UK dates, resampling, rolling averages and comparing periods.
  • Grouping and summarising: groupby, named aggregation, pivot tables, crosstabs and shares of a total.
  • Combining data: concat, merge and join types, checking merges, and reading a whole folder of Excel files.
  • Charts: clear line, bar, histogram and scatter charts with matplotlib, saved ready to share.
  • Real questions: repeat customers, products bought together, whether discounts worked, and checking your answers.
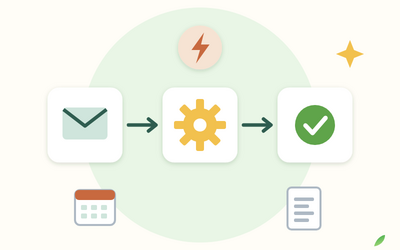
  • Reports and automation: formatted Excel output, tidy scripts with functions and a command-line month option.


The final project

You'll build one script that brings every data source together and produces an annual review workbook, a page of plain-English findings and a set of charts.


Who this course is for

  • People who have learned Python basics and want a practical use for them at work.
  • Spreadsheet users who are tired of copying and pasting the same report every month.
  • Anyone thinking about a move into data or analyst work who wants hands-on practice.


How the course works

Read each lesson with your code editor open, run the starter script, fill in the gaps, then compare your result with the solution and the expected output. Everything uses free software on Windows or a Mac. You keep lifetime access, so you can come back whenever you need a reminder.


What will I learn?

  • Set up Python, pandas, matplotlib and openpyxl in a virtual environment and write scripts that always find their data
  • Select, filter and sort data with pandas DataFrames
  • Clean messy data: missing values, wrong types, duplicates and untidy text
  • Work with dates and times, resample time series and calculate rolling averages
  • Summarise data with groupby, agg, pivot_table and transform
  • Combine data with concat and merge, and read a folder of Excel files at once
  • Make clear line, bar, histogram and scatter charts with matplotlib
  • Answer real business questions and automate a formatted Excel report

Requirements

  • You should know basic Python: variables, lists, dictionaries, loops, functions and running a script (Rootlet's free Python for Beginners course covers these)
  • A Windows PC or Mac where you can install Python 3.12 or newer and free packages
  • No paid software is needed; Excel or any spreadsheet program is handy for opening the reports you create

Frequently asked questions

It's for people who know the basics of Python and want to use it to analyse data for work. If you've never written Python, start with our free Python for Beginners course.

Python 3.12 or newer, plus the free pandas, matplotlib and openpyxl packages. Lesson 1.2 walks you through installing them in a virtual environment on Windows or a Mac.

No. The course uses ordinary Python scripts that run in IDLE, VS Code or the terminal, so you can use what you already have.

Yes. Every section has the data files, starter scripts with gaps to fill, full solution scripts and a cheat sheet, all built on a year of realistic data for a fictional tea company.

No. Every lesson is written out step by step, and every section has practice files to download. There are no quizzes, tests or deadlines, so you can learn at your own pace.

You get lifetime access, with no expiry date. Come back to any lesson whenever you need a refresher.

Yes. You can ask for a refund within 14 days of buying if you've completed less than 30% of the course. Email support@rootlet.co.uk.
Python for Data Analysis: Clean, Analyse and Chart Data with pandas

£34.99

Lectures

60

Quizzes

10

Skill level

Intermediate

Expiry period

Lifetime

Certificate

Yes

✓ 14-day money-back guarantee if you have completed less than 30% of the course. Refund policy

✓ Secure card payment by Stripe

✓ Questions before you buy? support@rootlet.co.uk

Sold by Rootlet Academy Ltd, a UK company (no. 17529179).

Share this course

Related courses

Learn something new every week

One short, practical tip each Thursday, plus news when new courses open. Free, and you can unsubscribe in one click.

We'll never share your email. See our privacy policy.